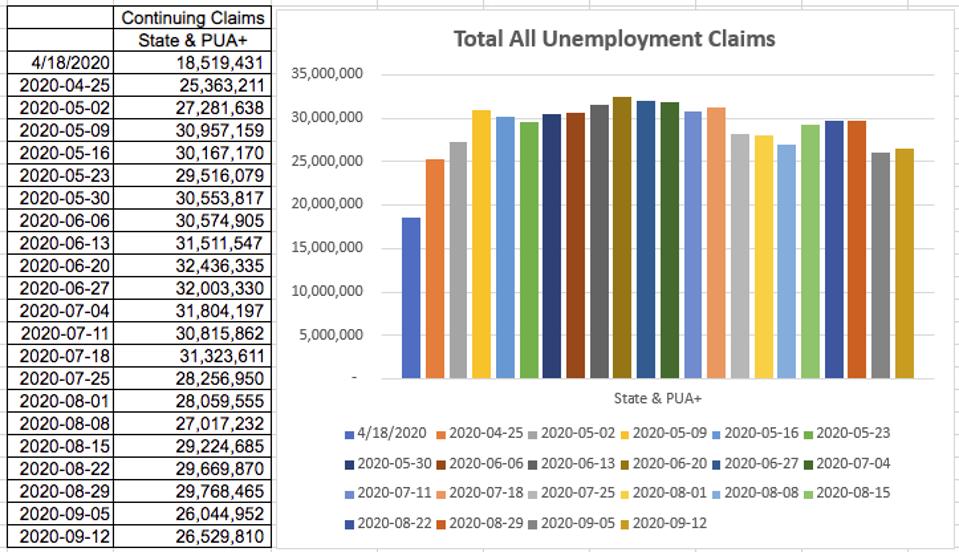
Total All Unemployment Claims
Personal income fell -2.7% in August. Still, consumer spending rose 1.0% M/M. What Gives?
The economy is still very much an employment story. While the official U3 unemployment rate fell to 7.9% from 8.4%, the underlying data was, simply put, “ugly!”
“Excess” Savings
Last week, I discussed the theory that the “excess” savings from the stimulus packages (one-time stimulus checks and the now expired supplemental $600/week in unemployment benefits) would carry the economy through Q4. No Way!

Buildup of Excess Savings
The pre-virus savings level was $1.2 trillion. The CARES Act stimulus ballooned savings to $6.40 trillion in April (everything was closed; nothing to spend it on except toilet paper, bottled water, and some frozen entrees). Then the re-openings began. In May, savings fell by -$1.9 trillion. In June, by -$1.0 trillion. Then it levelled off. July was -$0.2 trillion, August -$0.8 trillion. Personal savings stood at $2.4 trillion in August, not all that far from the pre-virus average level of $1.2 trillion.
The fall in savings explains how consumer spending actually rose by +1.0% in August despite a fall in income (-2.7%), the impact of not receiving the supplemental $600/week in unemployment benefits. Furthermore, I see a continuing negative impact on income as significant layoffs occurred in August and September as noted in the media and the latest unemployment releases.
It is highly unlikely that savings are going to return to the pre-virus $1.2 trillion level. As pointed out last week, history shows that precautionary saving increases significantly after such employment shocks. In the current episode, there is evidence that a significant chunk of the lower wage community did not have access to enough cash to survive for 90 days. Do you think they will spend their entire stimulus windfall? In addition, a goodly portion of the cash gifts were given to folks that didn’t need it. That likely won’t be spent, and certainly some of it was used by Robinhood type traders to play in the financial markets.
So, we enter Q4 with no, or almost no, savings ammo left from the CARES Act stimulus. And, while discussions between the politicians continue, even if a new (and much needed) stimulus bill is passed and signed into law, it will still be some time before the funds reach the populous.
Employment
Employment data continue to be the most reliable indicators of the real state of the economy. Don’t be fooled by the headline unemployment rate for August indicating a lower unemployment rate (7.9% vs. 8.4% for July). Eighty percent of the fall in that rate was due to a contraction in the labor force participation rate (the percentage of the population that are working or looking for work). A falling participation rate occurs when the unemployed get discouraged, stop looking for work, and drop out of the labor force because they can’t find jobs. As a result, the denominator (the labor force) is smaller, so, if there were the same number of jobs as in the previous month, the employment rate would rise and the unemployment rate would fall despite the fact that no net new jobs were created.
The table below shows the payroll numbers by month since April, the percentage of the unemployed that have been unemployed for 27 weeks or more, and the average duration of their unemployment. The trends are all going the wrong way.

Payroll Numbers
The Headline Payroll Survey
The Establishment Employment Survey (the “Payroll” Survey) for September indicated net new job creation of 661,000, a disappointment from the 800,000+ expected. To show how bizarre the data is, the private sector added 877,000; the public sector shed -216,000 (-281,000 in education). The education numbers appear to be a disaster, but a look under the hood shows that the losses are 100% a function of the seasonal adjustment (SA) process. As I have indicated in past blogs, when “normality” vanishes, so should seasonal adjustment. In this case, the non-seasonally adjusted (NSA) data show that jobs in education actually rose, but because the virus played havoc with school re-openings, the seasonal factors couldn’t cope.
The Household Survey
The monthly Household Survey is always more volatile than the Payroll survey. But it is disturbing to see this survey show net new jobs of only +275,000 in September after +3.756 million, +1.350 million and +4.940 million in the three prior months. This appears to be another indication of the significant economic slowdown post-stimulus. Some of the data were truly bizarre. As pointed out by Economist David Rosenberg, new jobs for 16-24 year-olds rose +718,000, so the 25+ population suffered significant job losses. Rosenberg also points out that those with college degrees suffered job losses of -2.0 million (and -5.1 million since the year started) while those with a high school education or less netted +1.5 million jobs. The Payroll survey data bears this out as most of the job gains in that survey were in the low wage sectors (leisure/hospitality, retail trade, transportation/warehousing).
One other crucial and discouraging factor: In the Household Survey, only +54,000 of the +275,000 net new jobs were full-time (seems reasonable given that the bulk of new jobs went to 16-24 year-olds). Corroborating this was a rise in the workweek in September to a record high 34.7 hours. This indicates that employers remain nervous about the future and would rather hire part-time, and/or work the existing employees harder, than commit to new hires.
The Weekly Data
Looking at the Initial Claims (IC) data, once again there is a holding pattern around 800,000 for the state programs (eight weeks in a row in August and September) and at 650,000 for the latest six weeks in the Pandemic Unemployment Assistance (PUA) program. Remember, this data is Initial Claims, meaning, these are new layoffs. At 1.45 million new layoffs/week, on average for nearly two months when combining both state and PUA ICs, it is hard to turn bullish about the state of the economy.
In total, the Department of Labor’s weekly unemployment data still shows 26.5 million unemployed as of September 12th (using both the state and PUA claims data)(refer to the chart/table at the top). That is a real unemployment rate of more than 17%. In addition, announced layoffs continue to be concerning. Besides the headline makers (Disney, the airlines), Morgan Stanley
Conclusions
Q4 has started off soft despite what will be a blockbuster Q3 GDP release at month’s end. Excess savings appear to have been depleted, and trends in the labor market are anything but rosy. Surely, this is a temporary condition that will pass when the virus is controlled (or there is a vaccine). As I write, there still isn’t a much-needed fiscal stimulus package, although it appears that one is getting closer. Finally, uncertainty notched even higher as the President, the First Lady, and several staff members have all contracted the dreaded virus.